Midwest Health Monitoring

Clinical Results

Background

Midwest Health Monitoring (MHM) offers a full‑service remote patient monitoring (RPM) program for chronic disease management. The company supplies turnkey cellular devices (scales, blood‑pressure cuffs, glucometers, and pulse oximeters) to each patient and handles onboarding, connectivity and training. Once enrolled, data from the devices flows automatically to MHM’s platform, where health coaches and nurses review measurements in real time, triage abnormal values and reach out to patients for clarification or education. Registered nurses (RNs) run a secondary triage service that investigates physician parameter breaches, escalates concerning trends to treating clinicians and documents every intervention. Physicians and clinics receive concise intervention summaries so they can adjust medications or schedule appointments without chasing down data. MHM provides the equipment, staff and triage infrastructure so provider offices do not need to hire extra personnel or build their own data systems.

Program Overview

The remote patient monitoring initiative with a well known Michigan Health System spanned from February 1 to September 1, 2025 and enrolled 475 patients across diverse clinical settings. Participants were drawn from specialized heart-failure and cardiology practices as well as a general primary care office and two rural health clinics serving outlying rural communities. Implemented as a turnkey solution, the program leveraged Midwest’s expertise to identify and onboard eligible patients seamlessly. MHM provided all necessary equipment and staffed a complete clinical team, ensuring continuous data review and triage. Throughout the engagement, nurses and health coaches collaborated closely with each practice’s physicians, surfacing concerning trends, validating critical readings, and recommending timely interventions to optimize disease control for each patient population. The three largest diagnosis cohorts were Hypertension, Congestive Heart Failure, and Diabetes.

Program Volume and Interventions

  • Time frame: 1 February 2025 – 1 September 2025. Patients were onboarded continuously, so later cohorts had shorter patient stay durations.
  • Patients served: 475 individuals across hypertension, congestive heart failure (CHF) and diabetes programs.
  • Readings collected: 46,959 biometric readings (blood‑pressure measurements, weights, glucose readings, oxygen saturation, etc.)
  • RN triage events: 1,257 instances in which nurses investigated a parameter breach discovered by health coach monitoring staff. Triage RNs perform patient outreach and document the event, the data, and patient interview for the treating physician.
  • Breach distribution: 58 % of patients triggered at least one level‑3 parameter breach (critical), 28 % triggered level‑2 breaches and 13 % triggered level‑1 breaches. Only 1 % (three patients) never exceeded any physician‑defined threshold during the monitoring period.
  • Total Patient Days of Service: 44,965 days of monitoring across entire patient population.

Hypertension Program Results

MHM’s hypertension cohort comprised patients who were previously uncontrolled or only marginally controlled on existing therapy. Key metrics are summarized below.

Metric Result Notes
Hypertensive patients with improvement
83 %
Patients exhibiting a lower average systolic or diastolic pressure during the late monitoring window compared with baseline.
Patients reaching target range
63 %
Proportion of hypertensive patients whose blood pressure readings moved into the target range defined by their physician.
Patients monitored ≥6 months with lower diastolic
81 %
Longer enrolment resulted in greater diastolic improvement.
All patients with lower diastolic pressure
59.3 %
Across all hypertensive patients, more than half lowered their diastolic pressure compared with baseline across all length of stay durations.
Patients monitored ≥6 months with lower systolic
71 %
Sustained monitoring correlates with larger systolic reductions.
All patients with lower systolic pressure
57.0 %
Over half of the cohort lowered their systolic pressure across all length of stay durations.
Reduction in critical hypertensive events/patient at 3 months
67.2 %
A comparison of critical hypertensive events rates during the first month vs. the third month shows a 67 % reduction in crisis-level episodes on a per patient basis.

Blood‑pressure Improvement Over Time

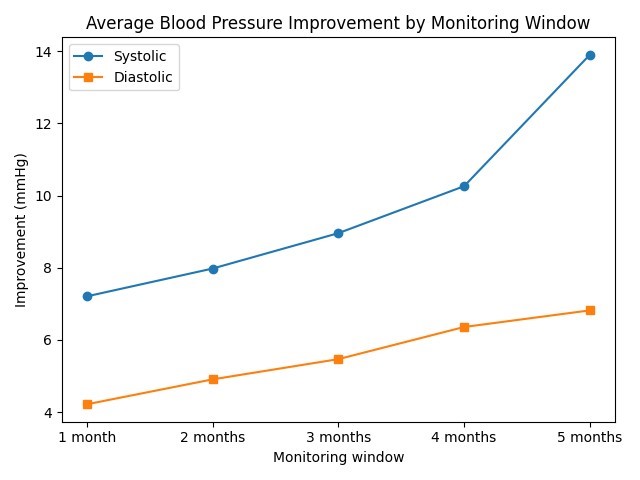
Average blood‑pressure improvements increased with the length of monitoring. After one month of RPM, patients showed a 7.21 mmHg reduction in systolic pressure and 4.22 mmHg reduction in diastolic pressure. After five months, systolic improvement reached 13.9 mmHg and diastolic improvement 6.82 mmHg, demonstrating that sustained RPM leads to progressively better control. A review of 48 randomized clinical trials found that each 5 mm Hg reduction in systolic blood pressure reduces the risk of major cardiovascular events by roughly 10 percent.

Remote patient monitoring dramatically reduced the number of crisis-level hypertensive episodes per patient. Crisis level events were defined as blood pressure exceeding 180 mm HG systolic and/or 120 mm diastolic. In the first month of monitoring, the program recorded an average of 0.32 events per patient. By the third month of service, that number fell to 0.105 critical events per patient, representing a 67 % reduction in the number of critical hypertensive events on a per patient basis. A combination of patient support and coaching, physician driven medication adjustments, and rapid identification of medication non-adherence are the primary drivers of these results, all enabled by real time physiological monitoring. 

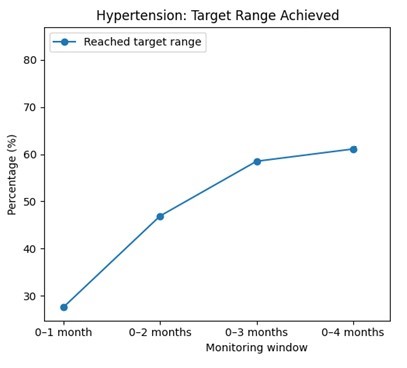
Patients reaching target range by monitoring window

The proportion of hypertensive patients reaching the target range climbed steadily with longer patient stays. Only 27.6 % of patients reached target after one month, but 61.1 % had done so by four months. We expect results to continue to improve with length of stay. These results show that sustained monitoring not only increases the percentage of patients reaching their target range, but also effectively holds patients in that range on a long-term basis.

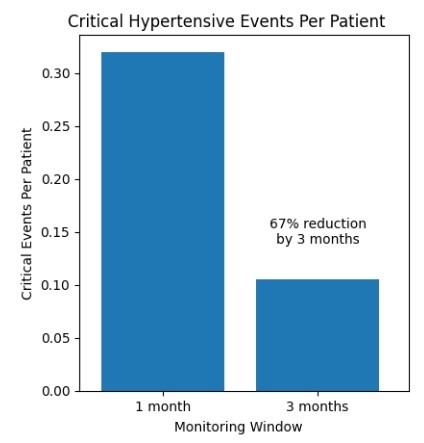
Critical Hypertensive events

Remote patient monitoring dramatically reduced the number of crisis-level hypertensive episodes per patient. Crisis level events were defined as blood pressure exceeding 180 mm HG systolic and/or 120 mm diastolic. In the first month of monitoring, the program recorded an average of 0.32 events per patient. By the third month of service, that number fell to 0.105 critical events per patient, representing a 67 % reduction in the number of critical hypertensive events on a per patient basis. A combination of patient support and coaching, physician driven medication adjustments, and rapid identification of medication non-adherence are the primary drivers of these results, all enabled by real time physiological monitoring. 

Congestive Heart Failure Program Results

Heart‑failure patients were monitored primarily using connected weight scales to detect early fluid retention. Rapid gains of ≥3 lb. in 24 hours or ≥5 lb. in a week are treated as critical alerts and trigger immediate RN triage and Physician escalation. Patient support goes far beyond threshold breaches: clinicians continuously review all vital data and regularly speak with patients about healthy living, diet, medication adherence and exercise. This holistic approach helps detect early signs of decompensation while empowering patients to manage their heart failure proactively.

Critical Weight‑gain Events

Monitoring window Patients Patients with ≥1 rapid gain (≥3 lb/24 h) Rapid gain events Patients with ≥1 large gain (≥5 lb/7 d) Large gain events Combined events per patient
1 month
71
34
74
28
62
1.915
2 months
65
22
53
19
40
1.431
3 months
53
14
32
11
17
0.925

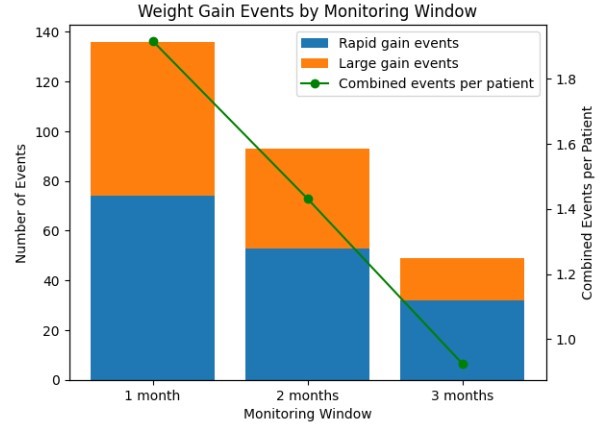
The total number of rapid and large weight‑gain events dropped sharply over time. Combined events per patient fell from 1.915 in the first month to 0.925 by month three—a 51.7 % reduction. The stacked bar chart below shows how rapid and large gain events decreased over each monitoring window, while the line illustrates the decline in combined events on an event per patient basis. 

Uncontrolled heart failure is considered one of the most expensive chronic conditions. Reducing critical weight gain events on a per patient basis by 50% in a three-month period represents one of the most effective population health solutions available today from the standpoint of both reducing acute utilization costs and driving life prolonging care. In another CHF/RPM study performed by Midwest for another client, the total CHF population mean coefficient of variation (MCV) of patient weight was reduced by over 65% in 18 months and held at 2.7% or less in a sustained manner. The combination of early episode stabilization (reduction of critical weight gain events) and long-term population stabilization at t=>12 months (sustained sub-3% MCV) offers a compelling solution for modern CHF management.  

Diabetes Program Results

Diabetic patients used cellular glucometers to transmit fasting and post‑prandial glucose values. Health coaches watched for hyper‑ and hypoglycemic excursions and contacted patients to confirm adherence to medications and diet.

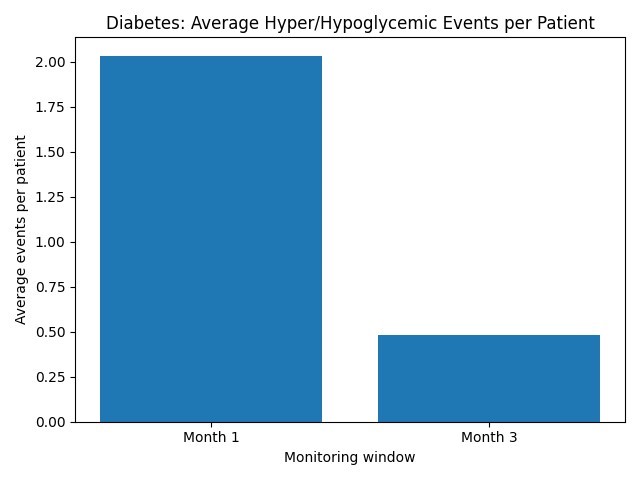
We analyzed the number of critical hyper/hypoglycemic events during the patient’s first month of service and then compared it with the number of critical hyper/hypoglycemic events in the third month of service. Providers generally consider values above 180 mg/dL to be hyperglycemia and values below 70 mg/dL to be hypoglycemia. The report grouped both hyperglycemic (>180 mg/dL) and hypoglycemic (<70 mg/dL) excursions as “crisis” events for the purpose of measuring program impact.

Monitoring window Average crisis hyper/hypoglycemic events per patient
Month 1
2.034483
Month 3
0.482759

Within the first three months of monitoring, the average number of hyper/hypoglycemic crisis events per patient fell from 2.03 to 0.48, representing a 76.3 % reduction. The bar chart below visualizes this sharp decline. Midwest found that many of the patients in the diabetes cohort were not regularly taking their blood sugar prior to joining the program. Since Midwest provides the patient with the glucometer and monthly allotments of testing strips, the patients were able to conveniently take their readings while also benefiting from health coach support.

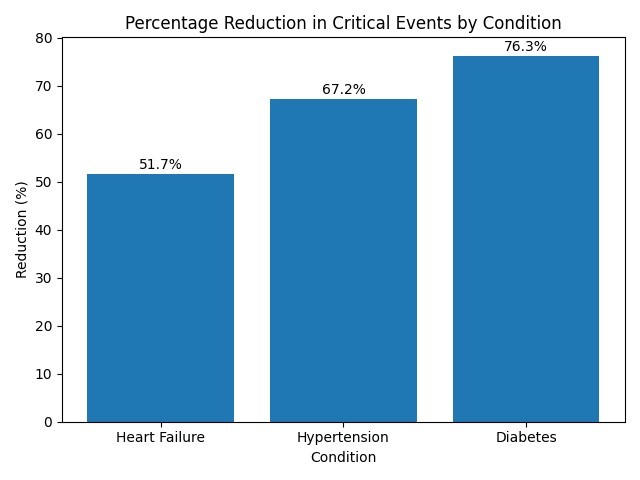
Comparative Reduction Across Conditions

Remote patient monitoring drove substantial reductions in critical events on per-patient basis across all three chronic conditions. Heart-failure patients experienced a 50% drop in crises, hypertensive patients saw an even steeper decline, and the diabetes cohort achieved the most dramatic improvement, with more than three-quarters of events avoided. Such improvements underscore how proactive monitoring and timely interventions can stabilize chronically ill populations. 

Anecdotal Evidence of Avoided ED and Hospital Utilization

MHM clinicians recorded individual patient intervention stories that illustrate how timely interventions can avert emergency department (ED) visits or hospitalizations. Selected examples are summarized below:

  • May 8: A patient reported increasing shortness of breath and bradycardia. RPM alerted the clinician, who discussed the findings with the patient’s physician. The patient was evaluated promptly, found to have fluid overload and received an outpatient dose of diuretic. Early intervention prevented ED visit and hospitalization from CHF exacerbation.
  • June 5: Continuous RPM showed a steadily decreasing monthly blood‑pressure average and symptomatic hypotension with light-headedness. RN triage surfaced this issue to the provider team while advising the patient to measure blood pressure before taking medications. The provider team ordered patient to hold Coreg and Entresto when systolic pressure fell below 90 mmHg. Medication timing adjustments stabilized the patient, avoiding syncope related fall and/or ED visit.
  • July 17: RPM detected critical (level 3) hypotensive readings. RN triage contacted the patient who reported dizziness, light-headedness and weakness. The triage nurse notified the practice, which scheduled a same‑day appointment and halved the patient’s losartan dose. The proactive adjustment prevented a syncope related fall and/or ED visit.
  • Sept 3: Health coach discovered patient with critical level 3 high heart rate and referred to RN triage. RN triage called the patient and gathered patient information and reported symptoms. RN triage contacted and reported finding to the provider and patient was immediately put in contact with provider vs going to ER. The Patient saw their Physician in clinic within one day (9/4) and was diagnosed with atrial flutter and scheduled for cardioversion.
  • Sept 1: During holiday monitoring, a patient’s blood‑pressure reading of 190/102 with an irregular heart rhythm triggered an immediate call by RN triage. After RN led education on proper medication timing, extensive patient emotional and clinical support, a repeat measurement two hours later showed stabilization, avoiding ED evaluation. The episode highlights how RPM can reduce panic induced ED visits in favor of timely clinical support.
  • May 17: RPM identified a 6‑pound weight gain in 24 hours with swelling and shortness of breath. The Triage RN notified the physician team and supported the patient while ensuring that the patient took the prescribed diuretic and provided close follow‑up over the next few days. Fluid balance improved, and hospitalization was averted.
  • Aug 22: Sustained critical hypotensive readings led RN triage to alert the provider team. Physician ordered reduction blood‑pressure medication. Ongoing monitoring showed that the patient remained stable and within target range. Early dose titration prevented adverse events.


These real‑world stories highlight how continuous monitoring, rapid triage and collaborative medication management can avert crises and keep patients safely at home. Please note, as many “close saves” Midwest’s RPM program produces, like those above, the most common outcome is simply happily stable patients. Midwest does not strive primarily to amass many “close calls” but rather seeks to help physicians manage patients more effectively so they’re never close to going to the ED in the first place.  

Financial Implications and Estimation Methodology

This report estimates the avoided emergency-department (ED) visits and hospitalizations that resulted from Midwest Health Monitoring’s remote patient monitoring (RPM) program, using strictly conservative assumptions. It applies measured reductions in critical alerts to plausible—but deliberately low—rates of conversion to acute care. Cost benchmarks come from U.S. public data on ED visits and inpatient stays. Even under these restrained parameters, the program shows a positive return on investment against its approximate $150,000 total cost to Insurance payors during the February–September 2025 evaluation window.

Methodology:

  1. Program results as inputs: Across 475 enrolled patients, the RPM program cut crisis-level events per patient sharply by month 3. For example, hypertensive critical events fell from 320 to 0.105 events/patient/month, CHF weight-gain alerts from 1.915 to 0.925, and diabetic hyper/hypoglycemic alerts from 2.034 to 0.483. These deltas (0.215, 0.990 and 1.551 events/patient/month) form the basis of our projections.
  2. Conservative conversion rates: We assume only a small fraction of critical alerts would ordinarily lead to ED visits or hospitalizations. For the super-conservative scenario, we apply 5 % (ED) and 2 % (hospital) for hypertensive crises; 10 % and 5 % for CHF crises; and 8 % and 3 % for diabetic crises. For the conservative (primary) scenario, conversion rates rise modestly to 7 % and 3 % (hypertension), 15 % and 8 % (CHF) and 12 % and 5 % (diabetes).
  3. Unit costs: Benchmark costs of acute care come from national sources. The average cost of an ED visit is about $2,715, and the average adjusted cost of an inpatient stay is about $14,101. To stay conservative, our conservative scenario further discounts these to $1,500 per ED visit and $10,000 per inpatient stay
Scenario ED visits avoided Hospitalizations avoided ED savings Hospital savings Total savings Net vs. $150k cost
Super conservative (floor)
≈35
≈16
$53k
$160k
≈$213k
≈$63k net
Conservative (primary)
≈59
≈26
$88k
$260k
≈$348k
≈$198k net
Payer average (sensitivity)
≈89
≈41
$242k
$578k
≈$820k
≈$670k net

These projections show a meaningful reduction in acute care utilization, and a clear ROI for the RPM program through Midwest. This report and these financial savings show clearly the power of livefeed physiological data being transmitted to trained clinicians working in concert with a proactive provider team. In reality, these projections serve as an absolute worst-case scenario from the standpoint of savings; the real savings are likely much greater.